

Getting Started With ELK Stack By Building Uptime Monitor.
What is ELK? long story short, ELK stand for Elasticsearch, Logstash, Kibana.
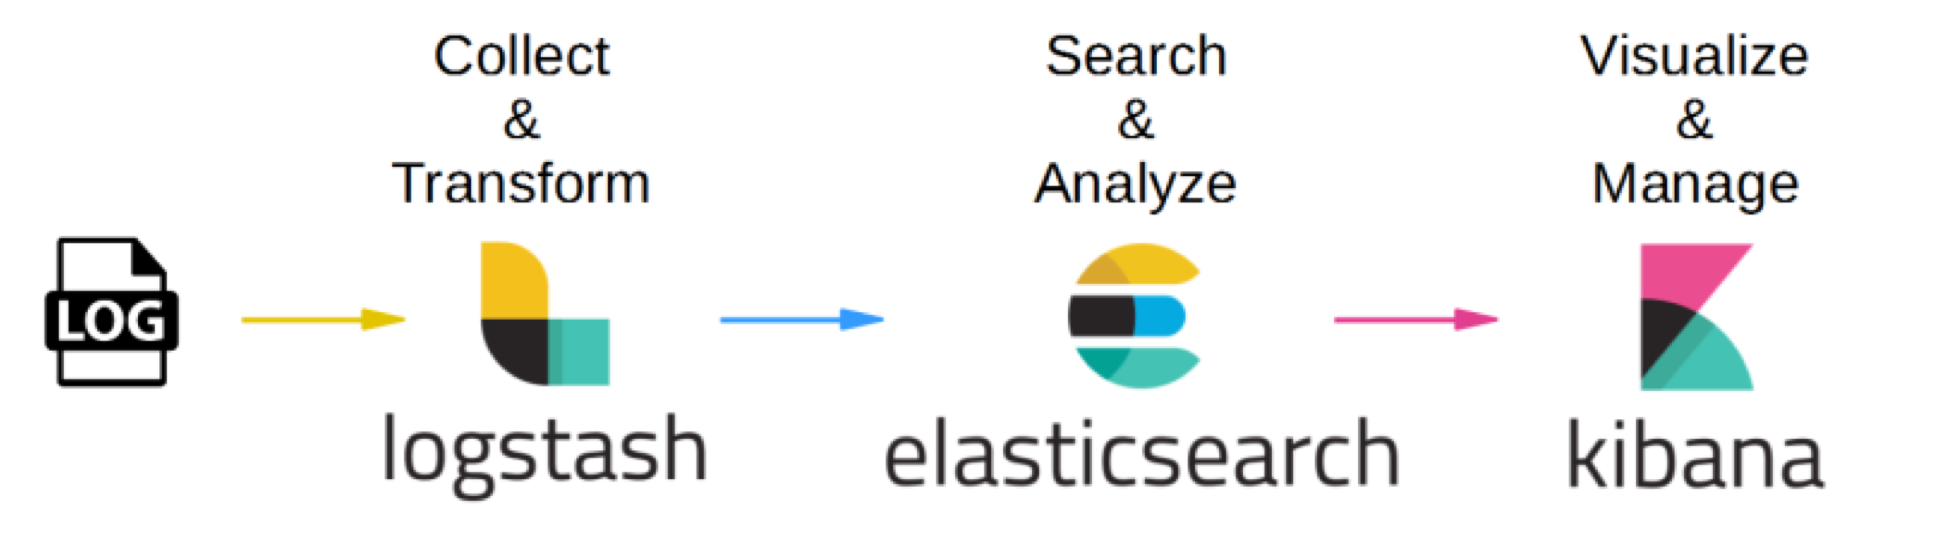
Elasticsearch is a full-text, distributed NoSQL database.
Logstash is a tool for collecting, parsing and storing logs for future use.
Kibana is an open-source analytics and visualization platform designed to work with Elasticsearch.
There is one more tool or tools I want to mention:
Beats a_ll kinds of shippers for all kinds of data (later on we are going to use Heartbeat from the beats family).
ELK stack can be overwhelming so I suggest we start with setup an environment and continue from that.
Quick setup with docker:
git clone https://github.com/niradler/docker-elk
cd docker-elk
docker-compose -f "docker-compose.yml" up
let's see what we got:
docker ps
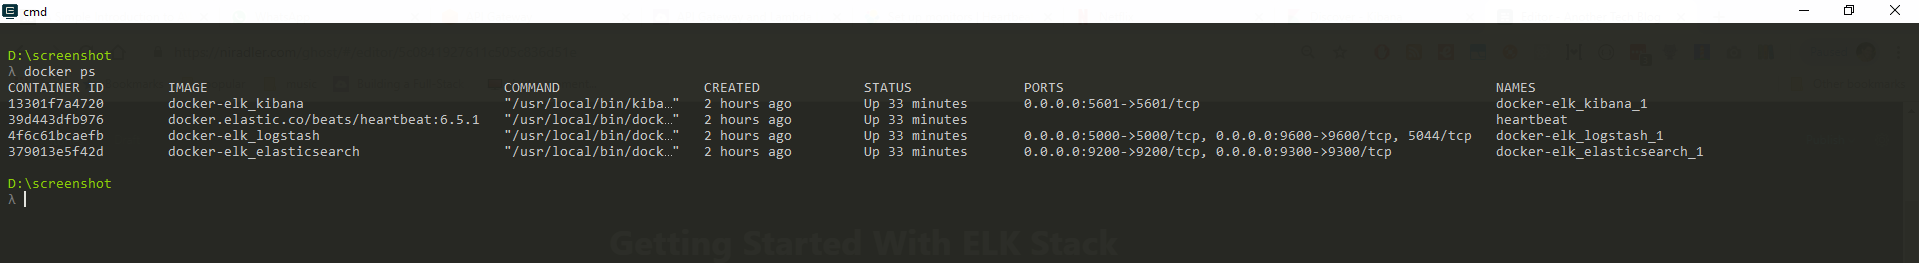
After docker-compose finish, we get 4 containers up, Kibana, Elasticsearch, Logstash and Heartbeat.
The purpose of the Elk stack is to store, analyze, and visualise data, so let's create data to work with, for that, I'm going to use Heartbeat (i choose this one only because it is simple to understand and very useful).
Heartbeat monitor services for their availability with active probing.
in the heartbeat folder, you can find the heartbeat.yml
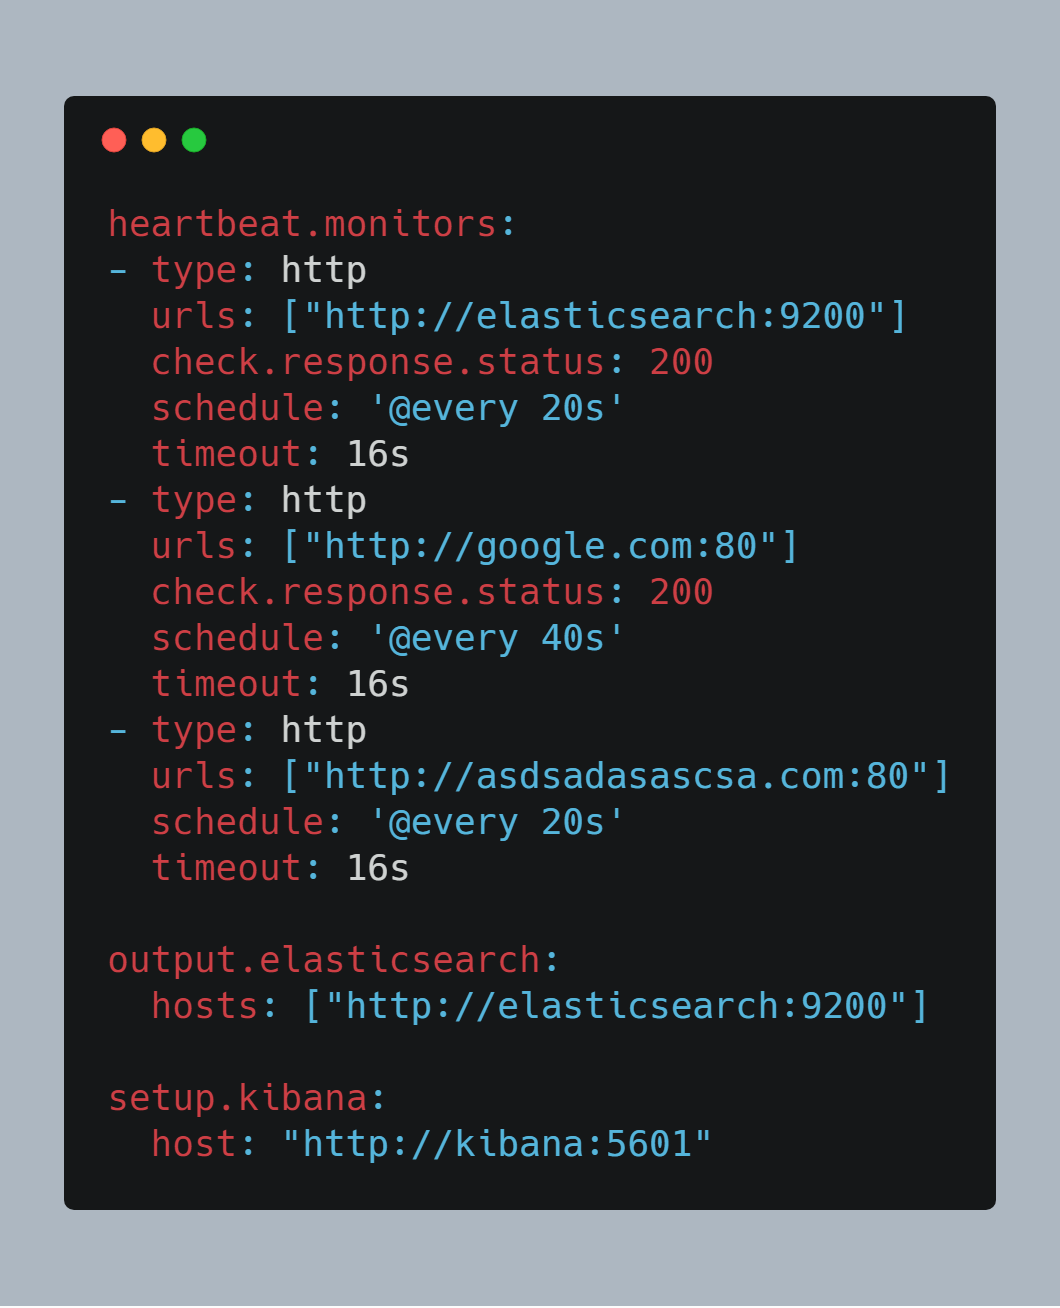
in this example I'm going to use heartbeat to call Elasticsearch root every 20s, google every 40s, and a random website every 40s, and of-course to report the result to Elasticsearch.
now let's open Kibana http://localhost:5601 and go to the management tab, choose Index Patterns and enter the index: heartbeat-*, press next and choose timestamp.
now we can go to the discover tab and get amazed.
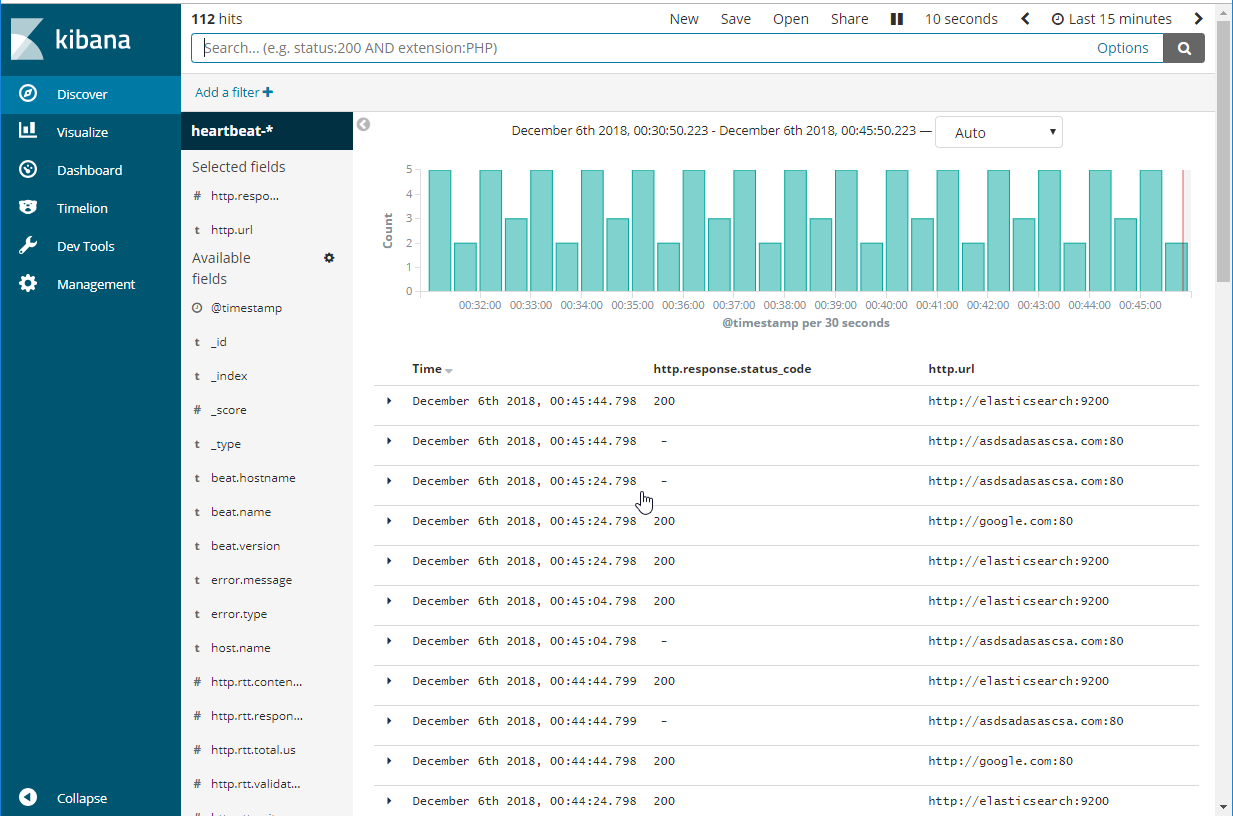
Notes:
Press the options button and turn on query features
Press the auto-refresh button and configure it to keep updating the data
Choose the field to show by hovering them in the side menu and press add
Search with monitor.status:up
let's move on to the Visualize tab, press the plus button and choose pie, on the left choose the index we created earlier, now let's visualize the statuses we get from heartbeat, press Split Slices and fill:
Aggregation -> Terms
Field -> monitor.status
Press the play button and you get:
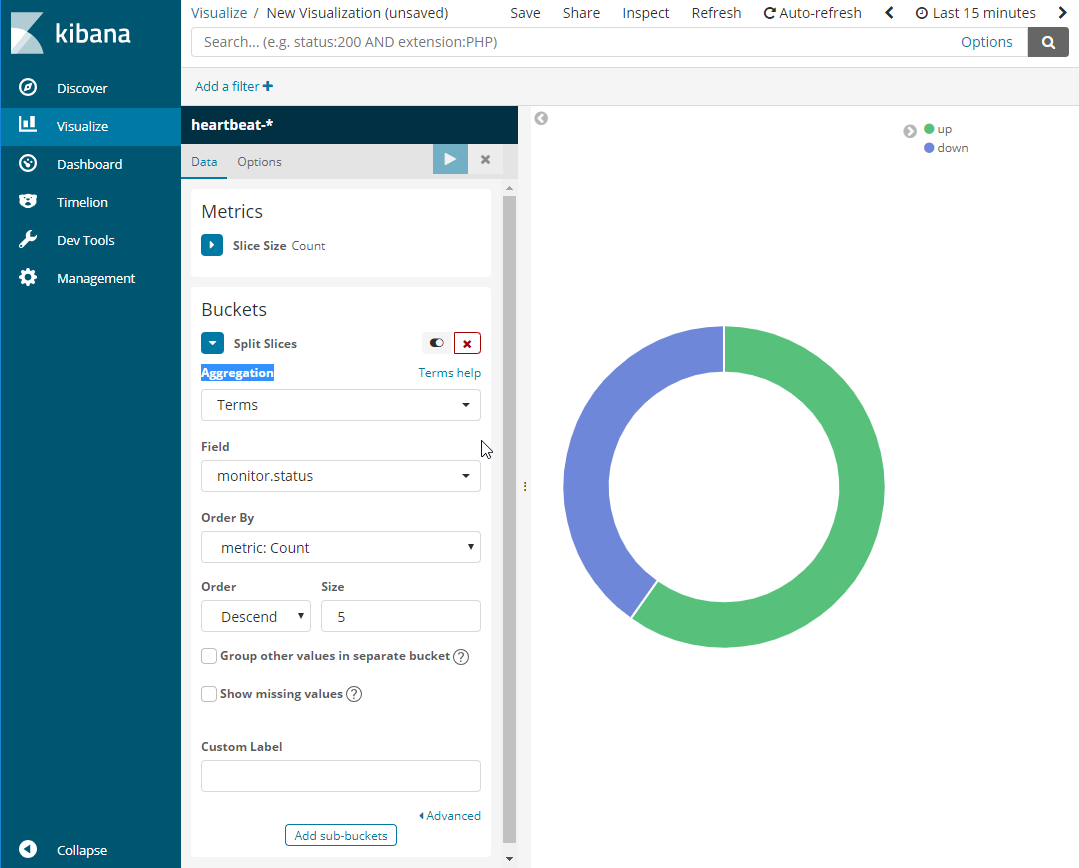
you can hover it to see the count, when you are satisfied with the result press the save button on the top and enter a name for the chart.
Notes and resources:
watch these official elastic videos: Elasticsearch, Kibana, Logstash
logz.io have lots of good examples and they are free to experiment with up to 3GB.
to experiment with Elasticsearch you can use the Dev Tools in Kibana.